
There is something I have learned to value more over the years: continuing to meet people who know things I still do not know. I found Graphify thanks to Federico, a developer I met recently who, compared with my age, is very young.
I always appreciate those encounters because younger developers often bring tools, approaches, and working habits that can escape the radar of those of us who have already spent many years writing code. Experience teaches many things; new generations, however, have a remarkable ability to discover and adopt solutions that change how work gets done. This was one of those moments.
I started using Graphify in a fairly large development project I am working on. The project is distributed across several repositories, with scattered documentation, different services, diagrams, databases, infrastructure, and a huge amount of context that is difficult to reconstruct when you are new to it or need to understand a specific area.
After trying it for a few days I understood why Federico recommended it so strongly: it let me move through the project in a completely different way, and honestly, it has been going very well. Today I understand the system much faster than before and can answer architecture questions without spending hours asking my agent for context.
What Graphify actually does
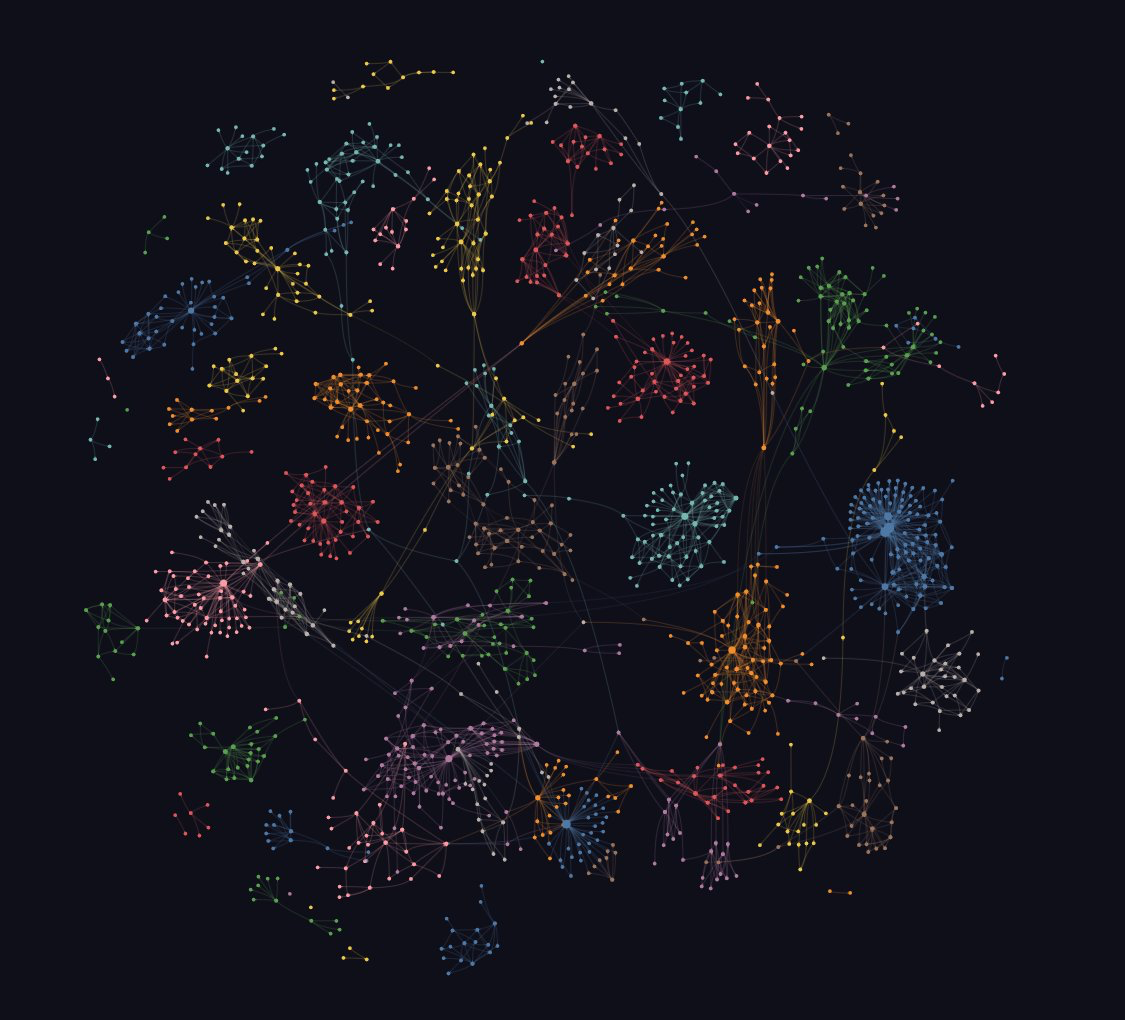
In short, Graphify turns a complete project into a knowledge graph that can be queried by both people and artificial intelligence assistants.
Instead of limiting itself to indexing files or generating embeddings, it builds a map where each system component, such as classes, functions, modules, documents, tables, APIs, and other resources, is connected through relationships that reflect how they actually interact with each other.
The result is a structural model of the project that makes it possible to understand flows, dependencies, and responsibilities without manually walking through hundreds or thousands of files.
To do this, it combines several technologies. It uses Tree-sitter to analyze source code with syntactic precision, incorporates language models to interpret documentation, PDFs, images, and other semi-structured content, and finally organizes all that information in a graph built with NetworkX.
On top of that graph, it can detect communities of components, relevant dependencies, overly coupled nodes, and relationships that usually remain hidden until someone spends weeks studying the codebase.
Why it changes work with assistants
Once the project has a graph, the truly interesting part begins. You can query it to identify the full path of the authentication system, discover which components connect two apparently independent services, explain the purpose of a specific module, or calculate the shortest path between different parts of the application.
For people who work with assistants like Claude Code, Codex, Cursor, Gemini CLI, or OpenCode, the benefit is immediate: the assistant stops exploring the project as a collection of isolated files and starts reasoning over the complete structure of the system.
This changes the quality of the answers. Instead of trying to infer relationships by reading loose files, the assistant has a structured model of the architecture. As a result, it can answer much more complex questions with less context.
Graphify can also export the generated knowledge into different formats. It can produce wiki-style documentation, Obsidian vaults, GraphML for analysis tools, exports compatible with Neo4j or FalkorDB, and even expose the graph through an MCP server so other assistants can query it remotely.
That turns the project into more than a dependency visualizer; it becomes a reusable knowledge layer for entire teams.
Privacy and AI providers
Another interesting detail is that source-code processing through Tree-sitter happens locally. When language models are used, they mainly help enrich documentation, PDF files, images, and other semantic content, reducing the need to send the entire source code to external services.
Graphify also supports multiple AI providers, from OpenAI and Anthropic to Gemini, Ollama, Azure, and Amazon Bedrock, which makes it relatively easy to adapt to different work environments.
Naturally, it has some limitations. In extremely large projects, with thousands of nodes, the HTML visualization can become heavy, so it may be better to work directly with the graph.json file or through the MCP server.
It is also important to configure the .graphifyignore file properly to avoid indexing generated directories, external dependencies, or files that do not add value to the analysis.
Complete Graphify guide
Step 1: install Graphify
The project recommends using uv, the package manager developed by Astral, although it can also be installed with pipx.
With uv:
uv tool install graphifyyWith pipx:
pipx install graphifyyOnce installed, it is worth running:
graphify installThis command installs the additional resources the tool needs.
To verify that everything was installed correctly:
graphify --helpIf the program help appears, the installation was successful.
Step 2: choose the project
Move into the project root folder.
For example:
cd ~/Projects/MyApplicationOr on Windows:
cd C:\Projects\MyApplicationThe important point is to run Graphify from the repository’s main directory.
Step 3: generate the graph
Now simply run:
graphify .The dot (.) means it should analyze the current directory. Depending on the size of the project, this process can take from a few seconds to several minutes.
During the analysis, Graphify:
- reads the source code;
- analyzes the documentation;
- detects classes and functions;
- finds relationships between modules;
- builds an internal graph;
- generates automatic documentation.
Step 4: review the results
When it finishes, a new folder appears:
graphify-out/Inside, you will find something similar to this:
graphify-out/
├── graph.html
├── graph.json
└── GRAPH_REPORT.md
Each file has a different purpose.
graph.html is the interactive visualization. It can be opened directly in the browser and lets you explore nodes, zoom in or out, inspect relationships, discover dependencies, and identify central components.
GRAPH_REPORT.md is an automatically generated report. It includes observations such as main components, highly coupled modules, possible “God Objects”, important relationships, and an architecture summary. Often, this document helps you understand a project before even opening the code.
graph.json is the heart of the system. It contains the full structured graph and can later be used by Graphify to answer queries without analyzing the entire project again.
Step 5: run queries
Once the graph has been generated, you can ask questions.
For example:
graphify query "Explain the authentication flow"Or:
graphify query "How does UserService interact with the database?"Also:
graphify explain UserServiceOr:
graphify path UserService DatabasePoolThese queries use the previously built graph, so they are much faster than scanning the whole repository again.
Step 6: understand dependencies
One of the most useful cases is answering questions such as:
- What calls this function?
- Who depends on this module?
- Which services use this class?
- What happens if I remove this component?
- What is the full path of an HTTP request?
In large projects, those answers usually require hours of manual navigation. Graphify obtains them by traversing the graph relationships.
Step 7: export documentation
Graphify can generate different formats.
For example:
graphify . --wikiThis generates wiki-style documentation.
Also:
graphify . --obsidianThis produces a vault ready for Obsidian.
Or:
graphify . --graphmlThis allows the graph to be imported into Gephi or other analysis tools. There are also exports compatible with Neo4j and FalkorDB.
Step 8: share the graph with the team
One possible practice is to share the folder:
graphify-out/That way, other developers can reuse the analysis and not everyone needs to rebuild the graph from scratch. In teams with large repositories, this difference becomes visible quickly.
Step 9: install the git hook
Graphify can automatically update the graph when the project changes.
To do that:
graphify hook installWhenever important commits are made, the graph can stay synchronized.
Step 10: use Graphify with AI assistants
Here is one of its greatest strengths.
Once the graph has been generated, assistants such as:
- Claude Code
- Cursor
- Codex
- Gemini CLI
- OpenCode
can directly query the structure of the project.
Instead of trying to infer relationships by reading isolated files, the assistant has a structured model of the whole architecture. As a consequence, it can answer much more complex questions with less context.
Configure AI providers
If you want to enrich the analysis with language models, you only need to define the corresponding key.
For example:
export OPENAI_API_KEY=your_api_keyOr:
export ANTHROPIC_API_KEY=your_api_keyThere is also support for:
- Gemini
- Ollama
- Azure OpenAI
- Amazon Bedrock
If you only analyze source code, many features continue to work thanks to Tree-sitter without requiring an external model.
Ignore unnecessary files
Just like Git uses .gitignore, Graphify has .graphifyignore.
It is useful to exclude directories such as:
node_modules
dist
build
target
coverage
vendor
This speeds up the analysis considerably.
When Graphify is worth using
Graphify is especially useful when there are:
- monorepos;
- multiple microservices;
- several related repositories;
- abundant technical documentation;
- legacy projects;
- large teams;
- onboarding processes for new developers;
- architecture audits.
In small projects the benefit is probably smaller, but as the system grows, the value of the graph grows quickly.